러닝스푼 수업 정리
수치형 x 수치형 : scatterplot, lmplot, jointplot
수치형 x 카테고리형 : boxplot, violinplot, barplot, heatmap
수치형 x 위치형 : folium 라이브러리 활용
본 포스팅에서는 seaborn 라이브러리의 distplot, relplot, jointplot, pairplot, boxplot, swarmplot, heatmap 을 사용한다.
데이터 불러오기 & 살펴보기
import seaborn as snsseaborn 을 import 해주고, 약어는 sns를 쓴다.
raw = sns.load_dataset('tips')seaborn 라이브러리에 저장된 데이터셋을 불러올 수 있다. 데이터는 데이터프레임 형식으로, pandas를 사용하여 분석할 수 있다.
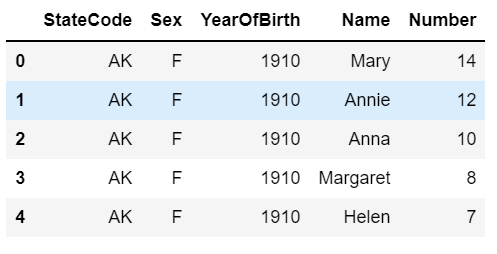
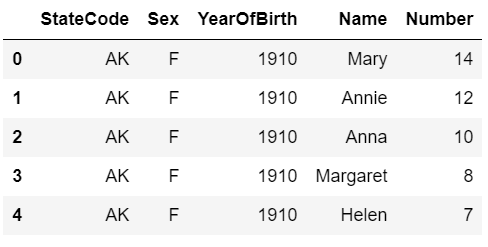
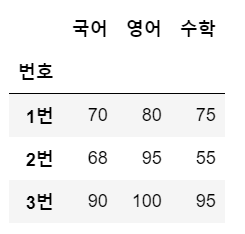
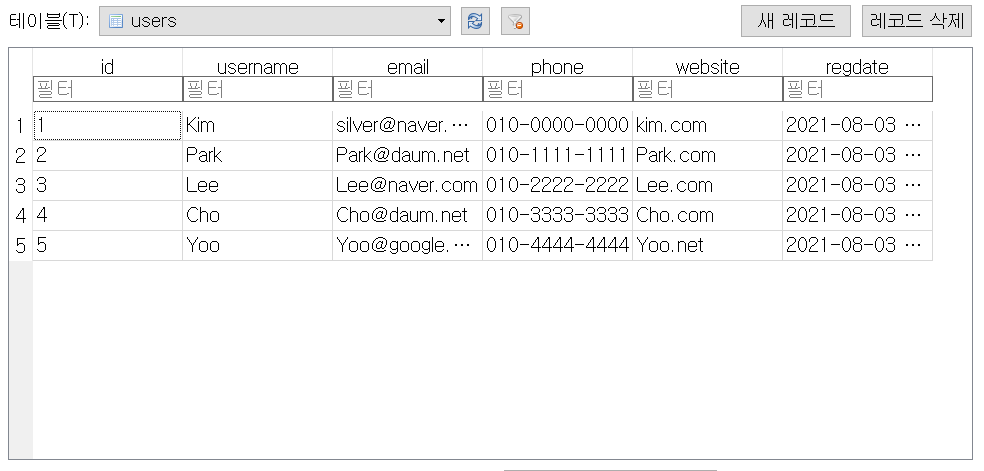
raw.head()
total_bill ( 총 금액 ) , tip ( 팁 ) , sex ( 성별 ) , smoker ( 흡연 여부 ) , day ( 요일 ) , time ( 식사 시간 ) , size ( 인원 수 )
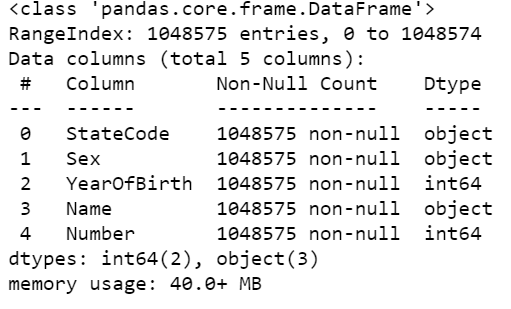
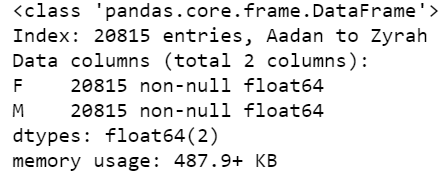
raw.info()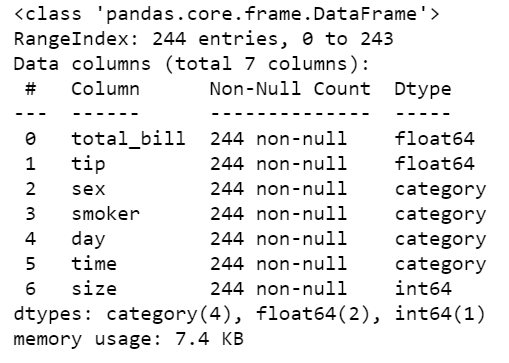
info()를 이용하여 row, column의 개수, data type, 결측값 확인을 해 준다.
데이터 분포 살펴보기 (수치형)
- sns.distplot( df[ '컬럼명' ] )
raw['total_bill']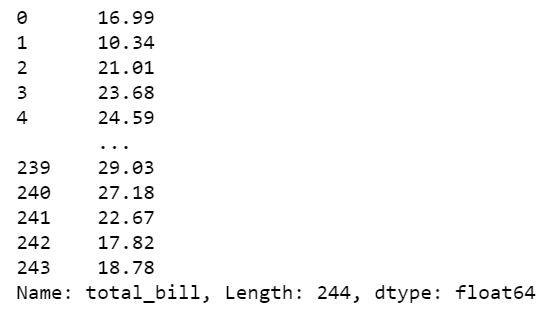
수치형 자료인 total_bill 컬럼의 분포를 살펴본다.
sns.distplot(raw['total_bill'])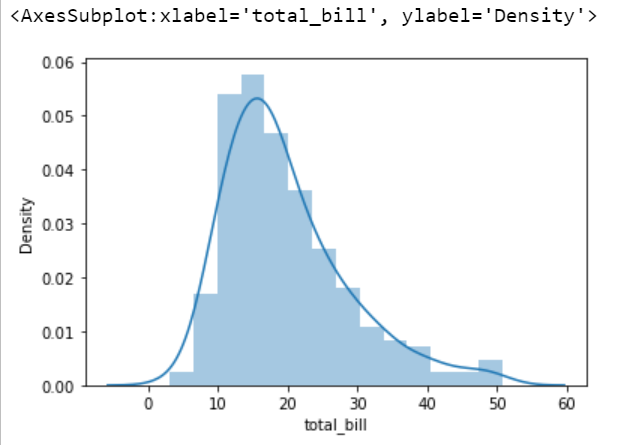
데이터 분포 살펴보기 ( 수치형 vs 수치형 )
- relplot( data=df, x=, y=, hue=, kind='scatter' )
: 두 개의 수치형 변수 분포 확인
- kind = 'scatter' (default)
- kind = 'line'
sns.relplot(x = 'tip', y = 'total_bill', data = raw) # kind 옵션 값 미지정시 "scatter"
sns.relplot(x = 'tip', y = 'total_bill', data = raw, kind = 'line')
sns.relplot(x = 'tip', y = 'total_bill', data = raw, hue = 'sex')
hue를 성별로 지정하여 성별을 기준으로 나누어 확인해볼 수 있다.
관계 살펴보기 (수치형 vs 수치형 )
- jointplot ( data=df, x=, y=, kind='scatter' )
- kind = 'scatter' : (default / point)
- kind = 'reg' : (point + regression)
- kind = 'kde' : 누적분포차트 like 지도
sns.jointplot(data = raw, x = 'tip', y = 'total_bill') # kind 값 미 지정시 기본 값은 kind = 'scatter'
sns.jointplot(data = raw, x = 'tip', y = 'total_bill', kind = 'kde')
sns.jointplot(data = raw, x = 'tip', y = 'total_bill', kind = 'reg')
sns.jointplot(data = raw, x = 'tip', y = 'total_bill', kind = 'hex')
kind='hex'는 kde와 비슷한데, 겹치지 않는 정육각형으로 표시된다.
- pairplot( data=df )
: df 의 모든 수치형데이터 컬럼에서 두 컬럼씩 관계를 시각화 함
sns.pairplot(data = raw)
서로 같은 컬럼이면 히스토그램을 그리고, 다른 컬럼은 두 수치형 데이터의 관계를 산점도로 표시해 준다.
sns.pairplot(data = raw, hue = 'sex')
hue를 성별로 지정하여 성별 간 분포를 확인할 수 있다.
데이터 분포 살펴보기 (수치형 vs 카페고리형)
- boxplot( data = df, x = , y = , hue = )
sns.boxplot(data = raw, x = 'day', y = 'tip')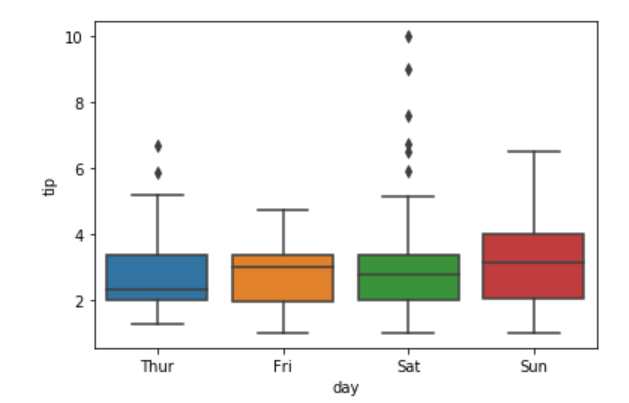
요일 별 팁의 분포를 확인한다.
sns.boxplot(data = raw, x = 'day', y = 'tip', hue = 'smoker')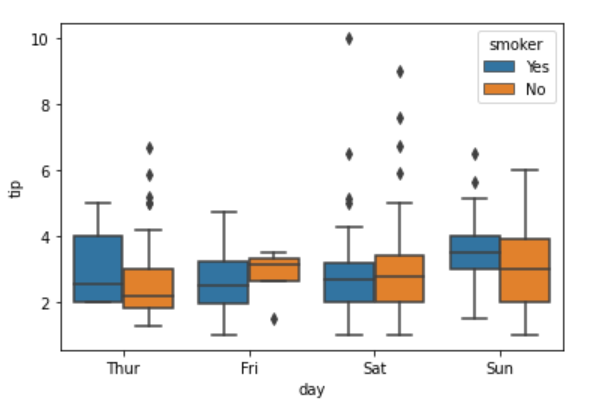
hue를 smoker로 지정하여 흡연자 여부를 기준으로 분포를 확인할 수 있다.
- swarmplot( data=, x=, y=, hue=, dodge= )
: boxplot과 비슷하다. boxplot은 하나의 기준에 대한 데이터 분포 범위를 파악하는 데 용이하지만 , 데이터의 개수를 표현하지는 않기 때문에 , 데이터 개수가 다른 값을 비교하기에는 문제가 있을 수 있다. 이 때 swarmplot을 이용한다.
sns.swarmplot(data = raw, x = 'day', y = 'tip', hue = 'smoker', dodge=True)

dodge=False로 하면 두 색이 겹쳐 나온다.
sns.boxplot(data = raw, x = 'day', y = 'tip', hue = 'smoker')
sns.swarmplot(data = raw, x = 'day', y = 'tip', hue = 'smoker', dodge=True)

boxplot과 swarplot을 겹쳐셔 그려볼 수도 있다.
sns.boxplot(data = raw, x = 'size', y = 'tip', hue = 'sex')
- barplot( data=df, x=, y=, hue= )
sns.barplot(data = raw, x = 'size', y = 'tip', hue = 'sex')
데이터 살펴보기 (수치형 vs 카테고리형 vs 카테고리형)
- heatmap( data = df )
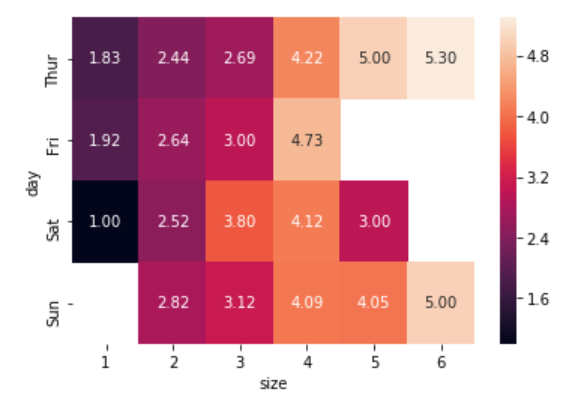
df = raw.pivot_table(index = 'day', columns = 'size', values = 'tip', aggfunc='mean')
df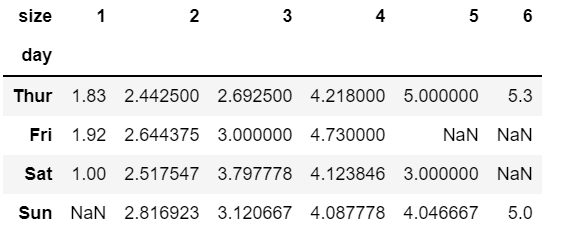
우선 인덱스를 day, column을 size, value를 tip으로 설정하여 요일 별 인원수에 따른 tip 테이블을 생성한다.
sns.heatmap(data = df)
카테고리형 - 카테고리형의 관계를 수치형을 이용하여 표현하는 heatmap이다.
다음과 같은 여러 설정을 할 수 있다.
sns.heatmap(data = df,
           annot = True, fmt = '.2f')
sns.heatmap(data = df,
           annot = True, fmt = '0.2f',
           cmap = 'Pastel1')
* annot : 숫자 표시, fmt : 숫자 포매팅 , cmap : 색깔
* cmap 추천 색 : Reds , Blues, Vlag, Pastel1, RdBu_r
'데이터 분석 이론 > 시각화' 카테고리의 다른 글
| [시각화 분석 프로젝트] 2-1 pandas로 여러 csv 파일 합치기 (0) | 2021.08.11 |
|---|---|
| [시각화 분석 프로젝트] 1-3. 특정 팀에 강한 야구선수 분석하기 (0) | 2021.08.10 |
| [시각화 분석 프로젝트] 1-2. 야구선수가 강해지는 계절이 있을까? (0) | 2021.08.09 |
| [시각화 분석 프로젝트] 1-1. best baseball player 분석 (0) | 2021.08.07 |
| [python 시각화] 2. 서울시 대피소 현황 지도 만들기 , 지도 시각화 ( folium 라이브러리 ) (0) | 2021.08.07 |